Extra Help (LIS) & Medicare Savings Programs (MSP): Mapping Those Potentially Eligible
3 min read

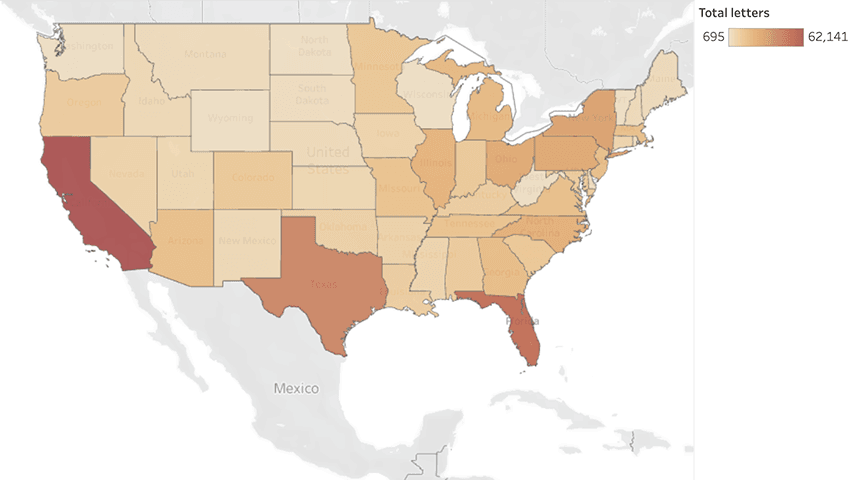
Each May and June, the Social Security Administration (SSA) mails letters to people enrolled in Medicare who are likely eligible for but not receiving the Part D Low-Income Subsidy (LIS), also known as Extra Help, and the Medicare Savings Programs (MSPs). There are two variations of these letters (View samples in English and Spanish at SSA's website):
- Form SSA-L447 is sent to individuals whose countable income appears to be less than 135% of poverty, and the beneficiary has Extra Help but does not have MSP.
- Form SSA-L448 is sent to beneficiaries whose countable income appears to qualify them for Extra Help and MSP, but the beneficiary has neither.
A third letter, Form SSA-L441, is sent to former Social Security Disability Insurance (SSDI) beneficiaries who lost their free Medicare Part A because of work and do not have Medicaid according to SSA records. We do not have data on these mailings so it is not included in the visualization below. SSA has released the number of letters that will be mailed to each ZIP code in the United States in May-June in order to help community-based organizations and state and local agencies more effectively target outreach on these vital benefits programs.
Note: While these data help identify those likely eligible for these two programs based on their Social Security benefit, Medicare beneficiaries may have additional sources of income or assets above the amounts allowed for the programs, and not all letter recipients may be eligible to enroll.
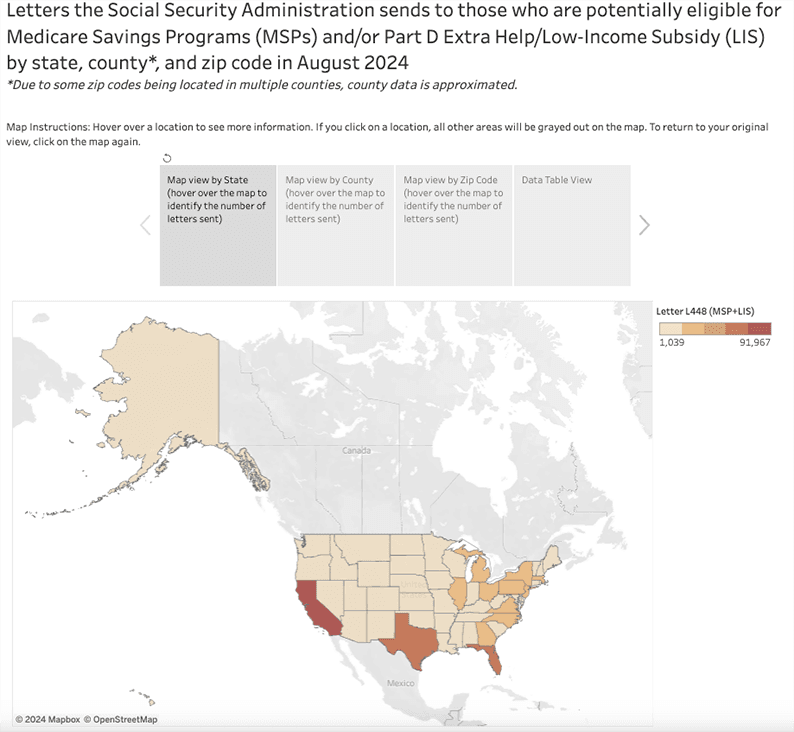
How to use NCOA's visualization tool that maps eligibility for Part D Extra Help and Medicare Savings Programs
Click on the image below to open the map or visit the tool using this link (may take a moment to load due to data volume). There are four separate tabs at the top of the visualization tool to view data at the state level, at the county level, at the ZIP code level, and in a table format. Zoom in and hover an area to get a pop-up box indicating how many letters were sent to that area.
You can download this data (from 2017 to present) from the SSA website.
To download the data from the visualization tool itself, click on the Data Table View tab at the top of the tool. Select the data you would like to download (for example, by clicking on the state name or a block of ZIP codes), and then click the down arrow button at the bottom of the visualization. Double-click to select the data download option.
Note: This works a little better with Google Chrome rather than Microsoft Explorer. Pop-ups need to be allowed on the page as well, because after you double click that you want the data downloaded, the screen appears in a pop-up box. Click download all rows as a text file. Having trouble obtaining the data you need? Reach out to us for assistance.