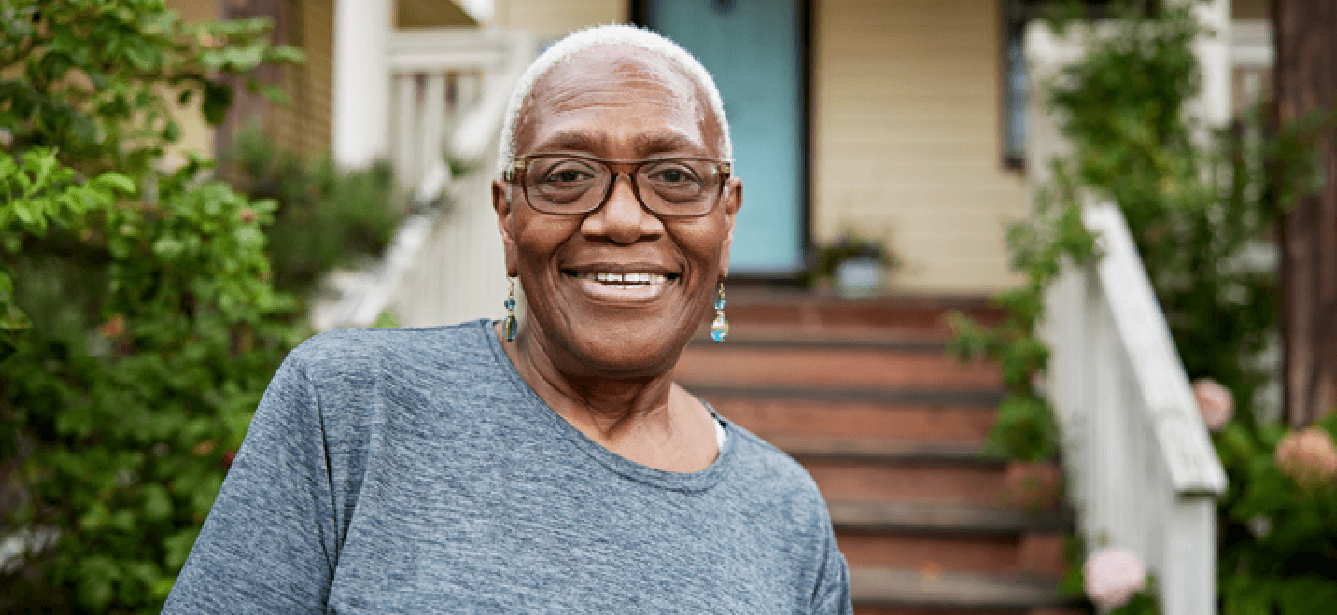


With people in the U.S. aging better and living longer, older adults are one of the fastest-growing groups in the country. In fact, by 2060, nearly 1 in 4 Americans is expected to be age 65 or older.1
Using insights from the U.S. Census Bureau, the ACL's latest Profile of Older Americans, and other sources, we’ve painted an eye-opening portrait of our nation’s older adults including key trends, challenges, and disparities.
| Older Adult Demographics: Quick Facts |
| According to the U.S. Census Bureau, adults age 65 and older made up 18.9% of the U.S. population in 2025.1 Based on the July 2025 population estimate of 341.8 million, that equals roughly 64.6 million older Americans. |
| In 2025, the United States ranked 48th among 227 countries by the age of its population.1 |
| The share of Americans age 65 and older is projected to grow from 18.9% in 2025 to 23.4% by 2060.2 |
| More than one-quarter (26.2%) of adults age 65+ were from racially and ethnic minority communities in 2024.3 |
| Delaware, Florida, West Virginia, Maine, and Vermont had the highest percentage of populations age 65+ in 2024.3 |
| Between 2010 and 2020, the number of Americans who have reached age 100 grew by 50%.4 |
| The 2024 median income of older adults was $33,310.5 |
Older adult health: Chronic conditions and life expectancy
Today's older Americans are healthier overall and living independently for longer. In 2024, people who reached age 65 could expect to live another 19.7 years on average—about two months longer than in 2023.6
But most older people have at least one chronic health condition, and many are dealing with multiple health issues. Research revealed the following about leading chronic conditions:
- More than 90% of adults age 65+—and over 75% of adults ages 35–64—are living with at least one chronic health condition, according to the Centers for Disease Control and Prevention (CDC).7
- Heart disease remains the number one cause of death for all Americans, affecting people of all ages, but especially those age 75+ (24.1%).8
- Arthritis was common among noninstitutionalized adults age 65 and older (47.8%) in 2024.8
- About 28.8% of adults age 65+ had been diagnosed with diabetes in 2023.9
- Obesity was also a significant cause for concern. Nearly 29.5% of older Americans age 65+ were considered obese in 2024.10
Poverty and economic insecurity among older adults
Economic insecurity is a pressing issue for older adults. Among Americans age 65+, more than 17 million were economically insecure in 2024—living at or below 200% of the federal poverty level (FPL) ($31,920 per year for a single person in 2026).11
Against the backdrop of rising inflation, older Americans are struggling with higher costs related to housing, utilities, groceries, and health care. Many also face diminished savings and job loss. Even for older adults who are making ends meet, a single health or other emergency can quickly tip the financial scales.
Some key facts on poverty among older adults from the U.S. Census Bureau:
- In 2024, 9.9% of U.S. adults age 65 and older lived below the official poverty line—about 6.1 million people. The rate was higher among adults age 75+ (10.7%) and older adults living alone (17.4%).
- Roughly 17.4% of adults age 65 and older who lived alone were below the official poverty line (3 million people).
- Older women faced higher poverty rates than older men. Among adults 65+, the rate was 10.8% for women and 8.9% for men. Among those 75+, the gap widened to 12.2% versus 8.9%. Older women living alone had a higher poverty rate than older men living alone: 18.3% compared with 15.8%.
- Among the groups reported, Black older adults had the highest overall poverty rate at 18.1%, followed closely by Hispanic older adults at 17.7%.
- More than one-third of older Hispanic adults living alone were in poverty, compared with 28.4% of Black older adults, 24.7% of Asian older adults, and 12.8% of non-Hispanic White older adults.11
Hunger and food insecurity among older adults
Poverty and hunger go hand in hand. Today, nearly 14 million older adults worry about having enough to eat, with food insecurity affecting older adults of color at disproportionately high rates.12 Consider these other facts on older adults and hunger:
- Hunger has a profound impact on older adults’ health and nutrition, increasing their risk for diabetes, depression, and asthma.13
- Older adults living with disability have nearly triple the rate of food insecurity as their peers without disability.14
- In 2024, adults age 60+ made up nearly 20% of SNAP participants.13 But NCOA found that only 38% of eligible adults age 65 and older participated in SNAP in 2023.15
Older adults in the workforce and employment
Many mature adults continue to work well into retirement, whether it's out of financial necessity or personal preference. Working for longer can help older people stay physically active and mentally sharp while maintaining important social connections. Employers stand to benefit from an older workforce as well. Seasoned workers bring knowledge, experience, and reliability that can’t always be matched by their younger counterparts.
Some fast facts about older Americans and employment:
- In 2025, 19.1% of adults age 65 and older were working or looking for work. While that was down from 20.2% in 2019, it remained higher than the rate in 2000.16
- Women represent 46% of all older workers.17
- Older workers report being more satisfied with their jobs than younger workers.17
- According to the Bureau of Labor Statistics, 9.5% of the civilian labor force is expected to be older than 65 by the year 2030.18
Family caregiving for older adults
Family caregivers play a large role in the care of older adults, with many of them also juggling a job, children, and other responsibilities. In 2021-22, 37.1 million family caregivers provided unpaid care to a family or non-family member age 65+.19
Older Americans are on the other side of caregiving as well. In 2022, 1.1 million grandparents (age 60+) were largely responsible for the care of grandchildren under age 18 that lived with them. In 2019, among the 5.37 million people with intellectual and developmental disabilities living with a family caregiver, 24% had caregivers who were age 60+.17
NCOA's role in improving the lives of older adults
The National Council on Aging (NCOA) is the national voice for every person’s right to age well. We’re creating the conditions for all to age well now and into the future. We will accomplish this by:
- Advocating for public policy change that supports all older adults, particularly those who are struggling, as well as the caregivers and community organizations that serve them.
- Empowering older adults to take charge of their own well-being by practicing falls prevention, chronic disease self-management, and mental health and wellness strategies.
- Connecting older Americans with quality health care services that meet their needs, including affordable prescription drugs, dental care, and long-term services and supports.
- Promoting awareness of and access to tools, resources, and knowledge that help all older adults age with dignity. This includes money-saving benefits, creating a job skills plan, job training, money management tips, and advice on retirement planning and protecting retirement income.
Sources
1. U.S. Census Bureau. Global Older Adult Population Projected to Nearly Double by 2060. August 31, 2026. Found on the internet at https://www.census.gov/newsroom/press-releases/2026/older-adult-population-projections.html
2. U.S. Census Bureau. By 2060, U.S. Population Will Be Younger Than Almost Half the World’s Countries Despite Continued Growth of Older Adults. September 03, 2026. Found on the internet at https://www.census.gov/library/stories/2026/09/an-aging-world.html
3. America's Health Rankings. Population - Age 65+ in United States (2024 Data). Found on the internet at https://www.americashealthrankings.org/explore/measures/pct_65plus/
4. U.S. Census Bureau. The U.S. Centenarian Population Grew by 50% Between 2010 and 2020. September 22, 2025. Found on the internet at https://www.census.gov/newsroom/press-releases/2025/centenarian-population.html
5. Pension Rights Center. Income of Today's Older Adults. March 5, 2026. Found on the internet at https://pensionrights.org/resource/income-of-todays-older-adults/
6. National Center for Health Statistics. Mortality in the United States, 2024. January 2026. Found on the internet at https://www.cdc.gov/nchs/products/databriefs/db521.htm
7. CDC. About Chronic Diseases. May 14, 2026. Found on the internet at https://www.cdc.gov/chronic-disease/about/index.html
8. National Center for Health Statistics. Older Adult Health. Found on the internet at https://www.cdc.gov/nchs/fastats/older-american-health.htm
9. CDC. National Diabetes Statistics Report. Found on the internet at https://usdss.cdc.gov/diabetes/report.html
10. America's Health Rankings. Obesity - Age 65+ in United States. Found on the internet at https://www.americashealthrankings.org/explore/measures/obesity_sr
11. U.S. Census Bureau. POV-01. Age and Sex of All People, Family Members, and Unrelated Individuals, 2024. Found on the internet at https://www.census.gov/data/tables/time-series/demo/income-poverty/cps-pov/pov-01.html
12. Meals on Wheels America. Fact Sheet: The Escalating Issue of Senior Hunger and Isolation. Updated January 28, 2026. Found on the internet at https://www.mealsonwheelsamerica.org/research/the-escalating-issue-of-senior-hunger-and-isolation/
13. Feeding America. The State of Senior Hunger. August 26, 2023. Found on the internet at https://www.feedingamerica.org/research/state-senior-hunger
14. USDA Economic Research Service. Supplemental Nutrition Assistance Program (SNAP) - Key Statistics and Research. August 31, 2026. Found on the internet at https://www.ers.usda.gov/topics/food-nutrition-assistance/supplemental-nutrition-assistance-program-snap/key-statistics-and-research
15. National Council on Aging. Estimation of National, State, and Substate Program Participation Rates for Adults 65 and Older. March 2026. Found on the internet at https://assets.ncoa.org/ffacfe7d-10b6-0083-2632-604077fd4eca/3462824a-d7e9-4ddb-a936-7c2172599005/Estimated_Program_Participation_Rates_for_Adults_65_and_Older_2023.pdf
16. Bureau of Labor Statistics - TED: The Economics Daily. Nearly one in five older Americans in the labor force in 2025. May 28, 2026. Found on the internet at https://www.bls.gov/opub/ted/2026/nearly-one-in-five-older-americans-in-the-labor-force-in-2025.htm
17. U.S. Administration for Community Living. 2023 Profile of Older Americans. May 2024. Found on the internet at https://acl.gov/sites/default/files/Profile%20of%20OA/ACL_ProfileOlderAmericans2023_508.pdf
18. U.S. Bureau of Labor Statistics. Number of people 75 and older in the labor force is expected to grow 96.5 percent by 2030. Found on the internet at https://www.bls.gov/opub/ted/2021/number-of-people-75-and-older-in-the-labor-force-is-expected-to-grow-96-5-percent-by-2030.htm
19. Johns Hopkins Bloomberg School of Public Health. What Is the Caregiver Crisis? July 28, 2025. Found on the internet at https://publichealth.jhu.edu/2025/what-is-the-caregiver-crisis